
I have spent much of my career inside the energy industry, including at ConocoPhillips and Phillips 66. None of the analysis below relies on nonpublic information. Every figure comes from filings, earnings materials or public market data that readers can examine for themselves.
ProducerFinds and produces crude oil and gas. Higher commodity prices usually help what it sells.
MidstreamMoves and stores energy through pipelines and terminals. Contracts and volumes matter more than the headline oil price.
RefinerBuys crude and turns it into gasoline, diesel and jet fuel. Profit depends on the gap between input cost and product value.
Integrated majorDoes several of these jobs at once. One segment can improve while another deteriorates.
On August 3, the President told reporters that ExxonMobil and Chevron are making too much money based on a shortage, and that they had better cut the price at the pump.
Let me concede the first half of that sentence before I argue with the second.
The quarter was extraordinary. Chevron earned $12.1 billion, the largest three months in its history, at a 21 percent return on capital employed. Exxon earned $14.5 billion, which annualizes to roughly 19 percent on its capital base. Those are windfall numbers and they deserve the word. I am not going to spend a thousand words explaining that a 21 percent return is secretly modest. It isn't.
The argument is about the other half. Not whether they made a lot, but whether they made it based on a shortage in the sense intended, which is that they helped cause one, held something back, or set a price they could have chosen not to set.
That is a testable claim, and Exxon filed the test itself on August 3, the same day the President spoke. It is called a 10-Q. Almost nobody reads them. This one takes the record quarter apart line by line.
A Record Quarter, Taken Apart
Exxon's earnings rose $7.4 billion against the same quarter a year earlier. The majority of that increase did not come from selling crude oil at a higher price.
Figure 1 · ExxonMobil segment earnings
Refining drove 55 percent of the increase
Change in segment earnings, Q2 2026 versus Q2 2025, USD millions.
Refining
All other segments
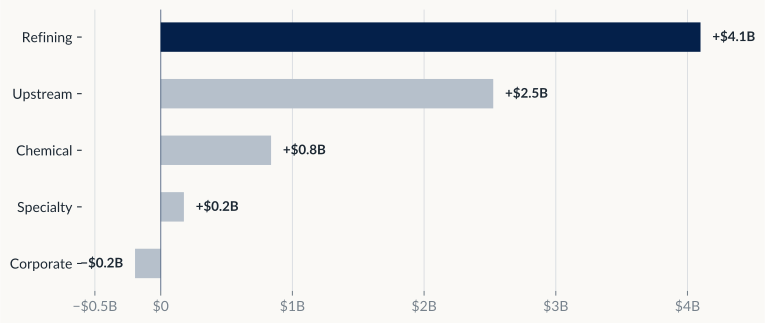
The refining segment quadrupled. The producing segment rose about 47 percent. That relocates the entire argument, because the story everyone is telling is that oil companies got rich when oil got expensive. The filing says the larger driver was the refining margin: the gap between what crude and other inputs cost and what the finished fuel was worth. That is a different market mechanism, and it requires different evidence before anyone assigns blame.
Go one level deeper and the company publishes its own walk for that number. Stronger refining margins added $3,180 million. Impairments took away $1,180 million. The Middle East disruption itself removed $310 million of volume. And one line added $2,560 million from favorable derivative mark-to-market, an accounting revaluation of open hedges at quarter-end. It was a timing effect, not current-period cash.
Hold onto that last one. It comes back.
The Quarter Nobody Held a Press Conference About
The war started in late February. So the first quarter of 2026 was already a disrupted quarter. Here is what Exxon's refining business did in it.
Figure 2 · ExxonMobil Energy Products
A $1.26 billion loss, then a $5.47 billion profit
Refining segment earnings by geography, USD millions.
United States
Non-US
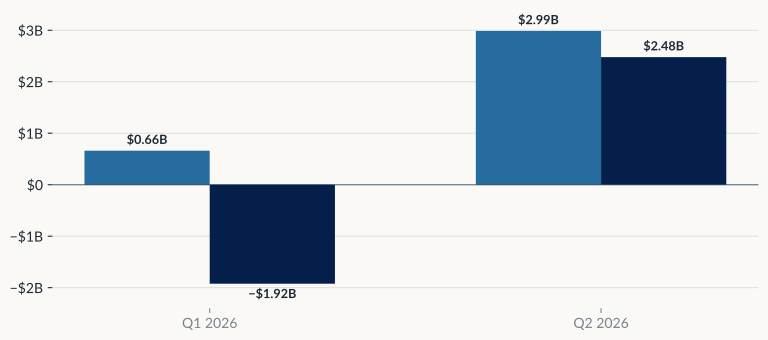
It lost $1.26 billion. Not a thin profit. A loss, during the disruption, with US refining making $661 million and non-US losing $1,923 million. The filing attributes it to Middle East supply disruptions preventing physical shipments against hedge positions, and the timing line for that quarter reads negative $3,330 million.
That is the mirror of the $2,560 million favorable timing swing in the second quarter. Across the six months the two lines net to negative $770 million, which is exactly what the year-to-date figure shows. The same accounting mechanism that magnified the second quarter also magnified the first-quarter loss. Neither quarter by itself describes the underlying business.
I want to be careful here, because this is the point most easily abused. I am not saying the profit is fake. Underlying refining margins were strongly positive in both quarters. I am saying that the reported timing effect swung by roughly $5.9 billion from one quarter to the next. Any argument built on a single quarterly number has to account for that.
Two independent refiners confirm the underlying economics were sound in the first quarter, which is what makes the hedge explanation credible rather than convenient. Valero earned $1,263 million in Q1 2026 against a $595 million loss the year before. PBF earned $198 million against a $402 million loss. Neither carries an international hedge book at Exxon's scale, and both made money.
The refining surge inside the record quarter was the back half of a two-quarter swing that opened with a $1.26 billion segment loss. Nobody condemned the loss, because almost nobody read it.
What You Actually Paid
None of that is an answer to the person filling a tank. So here is the arithmetic, and it is the least flattering exhibit in the piece.
Figure 3 · Retail gasoline
Crude explains about a third of it
National average, dollars per gallon.
Pre-war $2.98
Crude +$0.36
Refining and distribution +$0.76
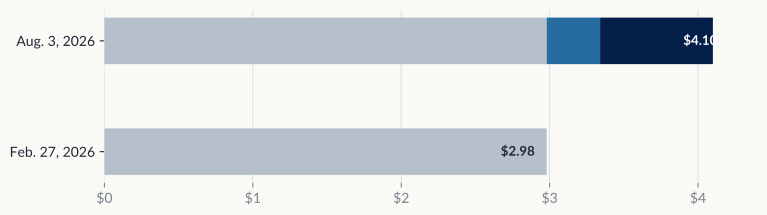
This is an estimate for scale, not a precise allocation of every cent. On that rough comparison, higher crude prices explain about one third of the increase. The rest cannot be assigned to one company or one cause: it reflects refining margins, product scarcity, inventories, distribution, marketing and timing. Exxon's segment results point in the same direction, but they are not a cent-by-cent map of the pump price. The stronger criticism therefore belongs in the refined-product market, not in a blanket claim that crude producers simply chose the price.
This is part of the pattern drivers already recognize: prices often rise faster than they fall. Replacement cost and inventories matter, but so do local competition, search behavior and market structure. The pattern is real; its cause is not always a conspiracy and not always innocent.
“Big Oil” Is Not One Business
Kinder Morgan owns 78,000 miles of pipeline, 136 terminals, and the refined-products hub on the Houston Ship Channel. It appears in the same speeches and the same index funds as the majors.
Figure 4 · Q2 2026 comparison
Same quarter, different businesses, opposite directions
Change in reported net income versus Q1 2026 and versus Q2 2025.
Versus Q1 2026
Versus Q2 2025
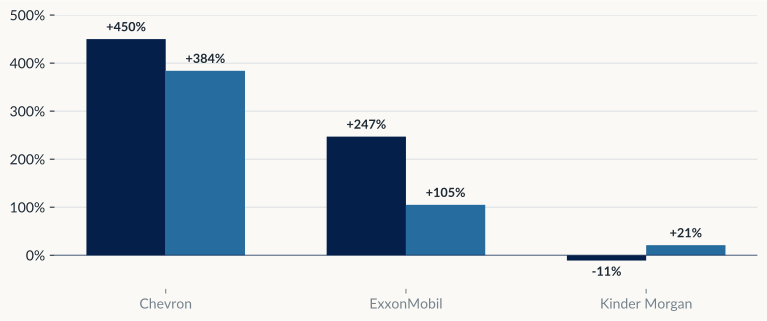
Kinder Morgan earned less than it had in the first quarter, but 21 percent more than in the same quarter a year earlier. Its businesses also moved in different directions. Natural-gas transport volumes rose 7 percent and gathering volumes rose 26 percent. Refined-products volumes fell 5 percent amid West Coast supply disruptions and the higher-price environment. Crude and condensate volumes fell 16 percent, largely because the Double H pipeline was converted to natural-gas-liquids service.
Even inside one midstream company, there was no single energy-profit effect.
Any explanation that treats every energy company as having the same result fails before it leaves the page. It is an observation about two famous companies, not an explanation of an industry.
Plains All American makes the same point from the revenue side, where a lot of public anger actually lives.
Figure 5 · Plains All American, FY2025
$44.3 billion of revenue. $1.4 billion of net income.
Revenue against commodity purchases passing straight through the company, USD billions.
Purchases passed through
Everything else, including net income
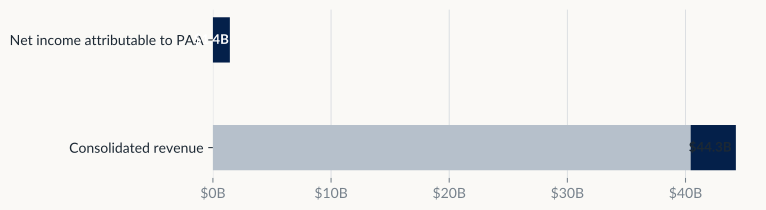
Calling that $44 billion of economic gain confuses the value moving through the enterprise with the value captured by it.
One Shock, Five Different Outcomes
The clearest way to see that the energy sector is not one business is to run the experiment backwards, on a downturn instead of a boom. The 2014 to 2016 crude collapse is the cleanest case on record, because it hit one end of the value chain and left the other end better off.
Figure 6 · The 2014–2016 crude collapse
The same price crash hit producers and refiners differently
Net income attributable to the parent, indexed to 2014 = 100.
ExxonMobil, integrated
Valero, refining
Plains, crude midstream
Kinder Morgan, gas midstream
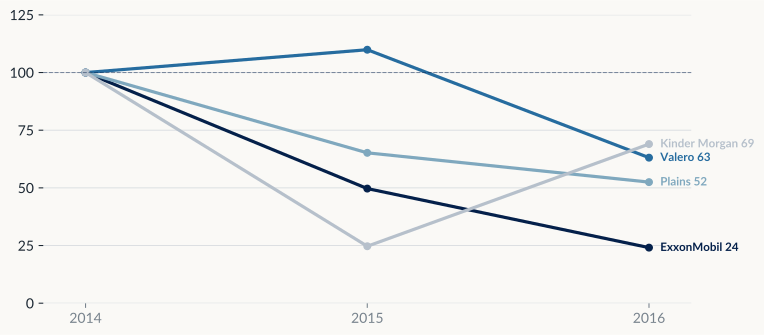
Read the lines against each other. Exxon lost roughly three quarters of its earnings. Valero, a refiner, earned more in 2015 than in 2014. PBF went from a loss to a profit. The two midstream companies drifted down on volumes and impairments without ever losing money.
That is not a coincidence or an accounting quirk. For a producer, crude oil is the product sold. For a refiner, crude oil is the raw material bought. The identical price movement lands on opposite sides of the two income statements. Midstream companies are steadier because contracts and tariffs matter more than the commodity price itself, but volumes, customer health, asset use, financing and impairments still matter. Kinder Morgan's latest quarter showed those effects moving in different directions inside the same company.
So when a politician says the oil industry is profiting, the first question is which industry. Producers, refiners, midstream operators, oilfield service companies, and chemical makers can be in five different cycles on the same day.
The Capital Is the Whole Argument
Everything above is about one quarter. The quarter is the wrong unit, and not because it is inconvenient. It is the wrong unit because of how this business is built.
A field takes years of geology, leasing, permitting, engineering and construction before it produces a barrel. A pipeline goes in the ground before the volumes arrive. A refinery needs continuing investment in safety systems, environmental controls, and turnarounds that shut down a billion-dollar asset for weeks on purpose. The capital gets committed in one market, built through another, and starts up in a third. Nobody making that decision knows what the world will look like when it pays off, and frequently it does not pay off at all.
Kinder Morgan is the cleanest illustration because it is supposed to be the steadier business. Many contracts are fee-based or take-or-pay, meaning customers pay for reserved capacity even when they use less of it. Here is twelve years of reported earnings.
Figure 7 · Kinder Morgan
Three troughs. Three different causes.
Net income attributable to Kinder Morgan, Inc., USD millions.
Annual result
Trough year
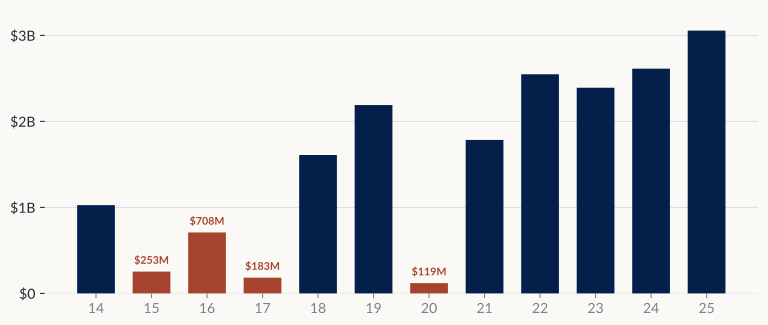
In 2015 it cut the dividend from $1.605 a share to $0.50, a reduction of roughly 71 percent from what it paid in 2014, to defend the balance sheet. Capital spending then fell 67 percent, from $3.9 billion in 2015 to $1.3 billion in 2021. That is what a capital contraction looks like in practice: a financial shock forces distributions down, less money is available for projects, and years can pass before spending returns to its previous level. It is evidence of the investment cycle, not proof that every deferred project should have been built. By 2025, annual capital spending had recovered to about $3.0 billion.
That is the steadier company. Now look at the largest one using return on capital employed, which measures profit against the enormous amount of capital tied up in the business.
Figure 8 · ExxonMobil
Seven years. Ten percent.
Return on average capital employed, the company's own disclosed measure.
Positive
Negative
Seven-year average 10.0%
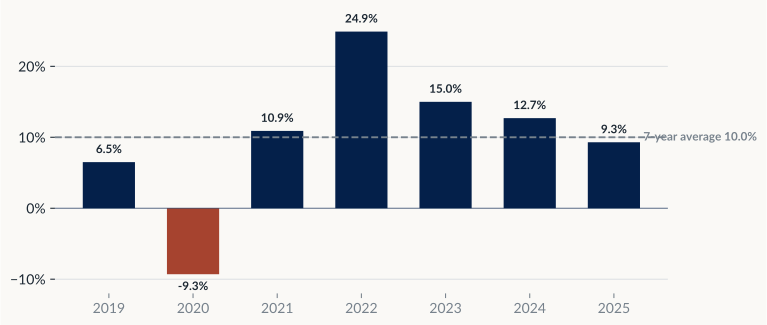
That arithmetic average includes 2022, the most profitable year in the company's history, and 2020, when it lost $22.4 billion and reported a negative 9.3 percent return on capital. Seven years do not settle every argument about the company, but the average is far less remarkable than the peak quarter. It is not, by itself, evidence of permanent monopoly returns.
The stock market record points the same way. From the end of 1999 through the end of 2024, the S&P 500 Energy sector returned about 7.5 percent a year against about 7.7 percent for the S&P 500 as a whole, with materially more volatility. That starting point is not unfavorable to Energy: year-end 1999 was near an oil-price trough and near the peak of the technology-market bubble. Even with that advantage, the full-period return was roughly in line with the broader market. Energy was among the three best-performing sectors in seven of those twenty-five years and among the three worst in nine. The good years are loud enough to be remembered and the bad years are numerous enough to cancel them out.
Figure 9 · S&P sector returns
Energy's long-run return was ordinary; its swings were not
Annualized total return from December 31, 1999 through December 31, 2024.
EnergyS&P 500Other sectors
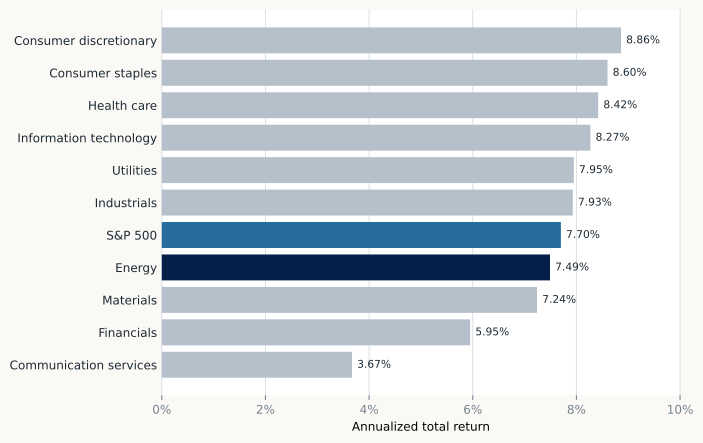
The honest formulation is not that energy underperforms. It is that energy periodically produces spectacular returns and has not produced persistently superior returns across complete cycles. The peaks are larger and far more visible. So are the collapses.
The famine side is not an abstraction, and it does not land only on executives. Between March 1982 and March 1987, Houston lost 212,000 jobs, 13.4 percent of its employment base, as the energy economy came apart. People who had done nothing wrong lost houses. I have watched a smaller version of it since. Record bonuses in one building and a thinned-out parking lot eighteen months later, and only one of those gets a press conference.
Where the Critics Are Right
The cash was not all required to keep the system running
Exxon generated $17.2 billion of free cash flow in the quarter and distributed $9.4 billion, including $5.1 billion of buybacks. Chevron repurchased $12.1 billion of stock in 2025 while total debt rose from $24.5 billion to $40.8 billion. The filings therefore do not support a blanket claim that all of the earnings were required to pay down debt or maintain infrastructure. Management made choices among acquisitions, debt, investment and shareholder returns. Whether that was the right call is a real question about governance. It is not the same question as price fixing.
Refinery throughput fell
Exxon ran 9.5 percent less crude worldwide than a year earlier while refining earnings quadrupled. That is the strongest number a critic has and I am handing it over. Where it sits matters: Asia Pacific down 28 percent, Europe down 16 percent, the United States down 3 percent. The declines were concentrated outside the United States, where operations were more exposed to disrupted Gulf crude flows. Exxon's own driver analysis says the lost volume reduced earnings by roughly $590 million rather than adding to them. Chevron, meanwhile, ran its US refineries at 97 percent crude unit utilization with record throughput and record US production.
Some of the inelasticity was chosen
After 2020 the majors promised investors capital discipline, which is a polite phrase for restrained growth to protect returns. An industry cannot spend five years telling shareholders it will not chase volume and then present its inability to chase volume as a law of physics. Both companies increased production and investment materially in 2026. The criticism still has teeth for the years before.
Prices rise faster than they fall
The asymmetry in retail fuel pricing is well documented and it is the best empirical card the critics hold.
Aim at the Actual Problem
The overwhelming majority of branded stations in this country are owned by independent operators. Exxon and Chevron therefore do not directly set most prices displayed on the roadside sign. The demand was that two firms cut a retail price they largely do not control in response to a shortage triggered by a war that began with U.S.-Israeli strikes on Iran.
That is not an argument for the oil industry. It is an argument for aiming at the actual problem.
| The problem | What the instrument actually is | Who can pull it |
|---|---|---|
| Households cannot afford fuel | Income-tested cash transfers through existing channels such as the tax code or energy-assistance programs. Economists generally prefer transfers to price caps or fuel-tax holidays, because a transfer helps the household without suppressing the scarcity signal that pulls in more supply. | Congress and state legislatures |
| Someone manipulated the market | Subpoenas for trading records, physical positions, storage data and internal communications, followed by enforcement where the evidence supports it. The authority already exists and does not require new legislation. | FTC, CFTC, DOJ Antitrust, state attorneys general |
| Windfall gains should be shared | A statutory excess-profits tax or a higher royalty rate on federal production, with the threshold, loss carryforwards and treatment of reinvestment written into the law rather than left to discretion. | Congress |
| One waterway carries too much of world supply | Physical redundancy: pipeline capacity that bypasses the chokepoint, more storage nearer to demand, diversified import sources and long-term contracts outside the region. Measured in years, not quarters. | Companies and allied governments, over a decade |
| Management allocated the cash badly | Shareholder votes, board composition, and executive pay tied to return on capital across a cycle rather than to production volume or the share price in a single year. | Boards and institutional shareholders |
Five problems. Five different instruments. None of them interchangeable, and none of them a statement.
The industry has earned some of this. It explains crack spreads and decline rates to analysts every ninety days and explains nothing at all to the public until gasoline is four dollars and the verdict is already written. You do not get to demand nuance only in the quarters when nuance helps.
But everything above came out of documents these companies filed voluntarily, on schedule, in public. The decomposition of the record quarter was available the same afternoon it was condemned. Nobody had to leak anything. Somebody just had to read it.
In this case, a big profit shows that scarcity and margins moved sharply. It does not, by itself, identify who caused them.
The gauge is not the leak.